Brewers Thrived as 2026 Postseason Scoring Fell to a Historic Low
Teams averaged 3.56 runs per game, but matchup quality explains part of October’s drought. Milwaukee was the lone playoff team with above-average wOBA.
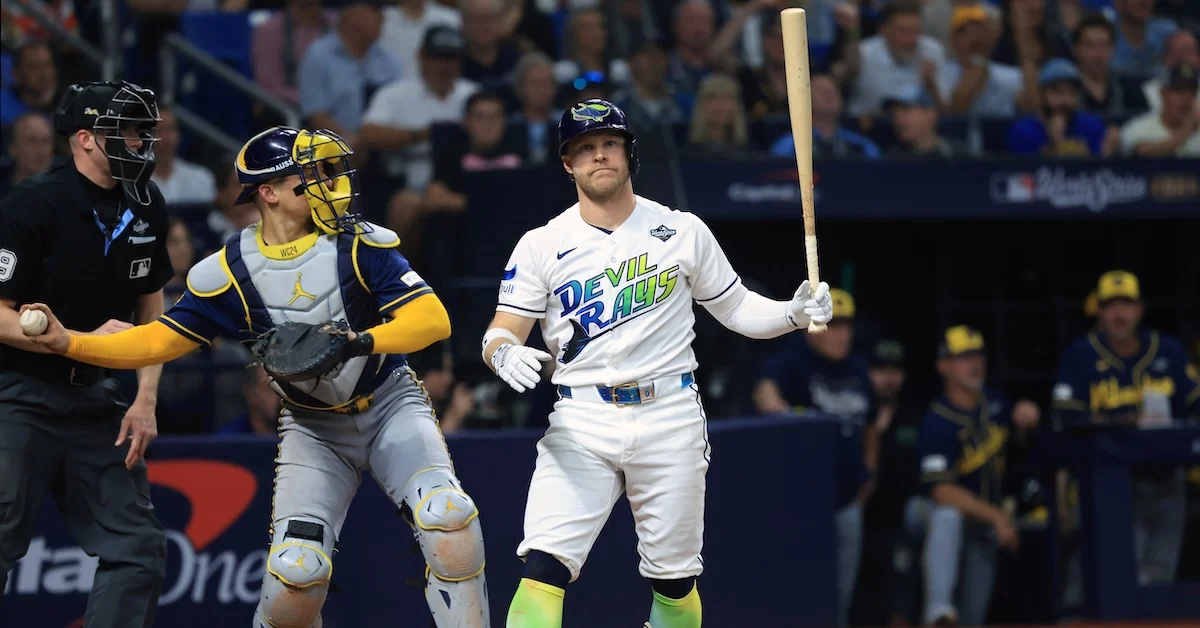
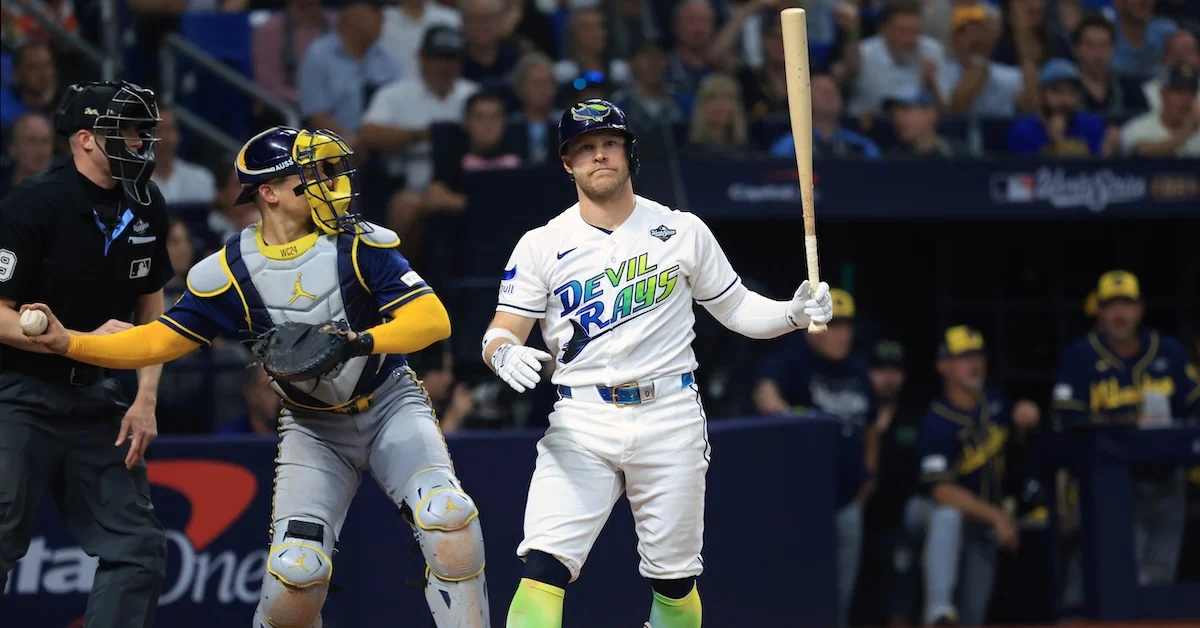
The Milwaukee Brewers had the 2026 postseason’s best offense and best pitching staff, and outscored opponents by two runs per game on their way through October. Most of the field had a very different experience at the plate. Postseason teams averaged just 3.56 runs per game, with hitters struggling to turn contact into production.
Only Milwaukee topped the regular season’s .314 wOBA benchmark, finishing at .328. The Yankees were next at .298, followed by the Padres at .293 and Guardians at .291. The contrast was stark at the bottom: the Cubs posted a .187 wOBA over two games, while the Red Sox managed .181 in two. The figures point to a broad offensive slowdown rather than a problem confined to one or two clubs.
Contact produced little damage
Across the league, postseason batting average was .217, down from .244 in the regular season. On-base percentage fell from .318 to .295, and slugging dropped from .400 to .336. Isolated power declined from .156 to .119, while wOBA slid from .316 to .282. Teams scored 3.56 runs per game, compared with 4.48 during the regular season.
Strikeouts rose only modestly, from 22.1% to 23.9%, and walk rate edged down from 8.9% to 8.7%. That makes the central problem clearer: when hitters put the ball in play, they weren’t getting enough hits or power. Strong pitching and defense stifled the contact-based approach many teams brought into the postseason.
The low scoring looked especially severe against recent Octobers. The 2026 mark was 79.5% of regular season scoring, the lowest share since 2006; only five postseasons since the divisional series era began in 1995 had fewer runs. The 2011 playoffs went the other way, scoring at 114.0% of the regular season rate. In 2025, postseason teams averaged 4.01 runs per game, or 90.1% of the regular season’s 4.45.
Matchups lowered the starting point
Raw comparisons miss an important feature of October: playoff teams don’t represent an average mix of hitters and pitchers. This year, the teams that reached the postseason brought especially strong run prevention. The eight teams with the lowest runs allowed per game in the regular season were among the playoff field’s nine teams, while several offenses were relatively modest.
To account for that balance, the analysis estimates expected runs in each playoff game from the competing teams’ regular season runs scored and runs allowed per game, using an odds ratio approximation. In the World Series matchup, Milwaukee scored 5.14 runs per game during the regular season and Tampa Bay allowed 4.01; the estimate put the Brewers at 4.60 runs per game. Tampa Bay scored 4.54, while Milwaukee allowed 3.81, producing an estimate of 3.87 for the Rays.
Across the 2026 postseason matchups, the estimate was 4.17 runs per game. Actual scoring came in at 3.56, a shortfall of 0.61 runs, or 14.6%. That’s a significant gap, but it fits a familiar October pattern. Since 2010, actual playoff scoring has usually trailed matchup-based expectations. The exceptions in the table are 2011, 2014 and 2015, when scoring exceeded the estimate.
The comparison with 2025 shows how much the field can shape expectations. Last year’s playoff teams had regular season offenses averaging 4.74 runs per game and defenses allowing 4.13, against a league average of 4.45. The matchups produced an expected 4.59 runs per game, helped by series involving the high-scoring Blue Jays and Dodgers against less effective run prevention. In 2026, powerful pitching and lighter-hitting teams pulled the estimate down before the first playoff pitch.
October’s pitching edge runs deep
Low postseason scoring isn’t a recent invention. A decade-by-decade comparison from 1900 through 2026 shows actual runs per game below the matchup estimate in every period. The largest gap came in the 1920s, when actual scoring was 3.54 against an expected 4.84, a 26.9% decline. In the 2000s, the gap narrowed to 6.7%; in the 2020s, it widened again to 10.3%.
Part of the longer history may reflect format. Before the Championship Series era, postseason scoring lagged expectations by 16%; since then, the gap has been about 8%. More games can make results less volatile, but the present decade raises another possibility: teams are finding ways to give their best pitchers more postseason innings. That leaves hitters facing stronger arms more often as elimination approaches.
The approach has deep roots. In the 1926 World Series, Yankees pitchers Bob Shawkey, Urban Shocker, Waite Hoyt and Herb Pennock took every one of the team’s World Series innings, despite combining for 61.6% of their regular season innings. The 2026 Brewers’ ability to extend their top arms belongs to a long tradition of postseason pitching concentration.
There’s uncertainty in comparing eras with different formats, and some of the recent change may be noise. Still, 2026’s offense was poor even after accounting for its difficult matchups—and October has long favored pitching over hitting. Debates about home runs, strikeouts, bunts or defensive limits may continue, but this postseason’s run drought has a lasting explanation: the best pitchers get the ball more often, and the best defenses are waiting behind them.