2026 MLB Pitching Location Awards: Megill’s Meatballs, Nola’s Curve and Guerrero’s Sinker
Trevor Megill led the majors in middle-middle pitches, while Tyron Guerrero’s sinker owned the zone. Aaron Nola and Grant Taylor excelled in dangerous territory.

Tyron Guerrero built his 2026 season around a simple challenge: put a 100.2 mph sinker over the plate and make hitters prove they can handle it. He did that more often than any other pitcher. But the location story across the league is less simple. A shrinking strike zone and increasingly potent pitching have changed how teams think about precision, even as the middle of the plate remains an especially costly place to miss.
This is the third installment of our pitching superlatives series, following pieces on velocity and movement. The strike zone had already been contracting for several years, as discussed in this look at whether umpiring had plateaued. The introduction of the ABS challenge system accelerated that change in 2026.
At the same time, pitchers have grown so confident in their stuff that teams sometimes encourage them to attack the middle instead of nibbling. The Angels even had pitchers face the Traject Ark’s version of their own pitches to show them how difficult their offerings were to hit. That approach has a logic: better stuff can get outs without perfect placement. Still, location shapes the risk. Statcast’s Attack Zones show why the center of the plate remains the danger point.
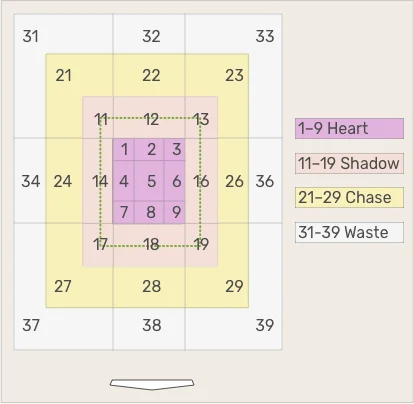
A pitch in Zone 5, right down the middle, was 69% more likely to become a home run than another pitch in the strike zone. Middle-middle pitches accounted for 23% of home runs, despite making up only 7% of pitches. The broad idea that pitchers can serve up home runs still holds, though the value of command depends on the pitch and the situation.
In a 2024 examination of the “Throw It Down the Middle” approach, I found that pitch quality mattered more outside the heart of the plate. On pitches in the heart zone, Stuff+ and hard-hit rate had a correlation coefficient of -.32; outside it, the figure was -.42. Better stuff helped everywhere, but it separated pitchers more strongly away from the middle. Once a pitch became a meatball, its quality mattered less. That’s the tension behind this approach: great stuff can cover a mistake, but it doesn’t make the mistake harmless.
For the season’s location awards, the sample includes 1,540 offerings thrown at least 152 times. The Meatballiest Pitch was Brandon Pfaadt’s sinker. It landed in Zone 5 on 14.9% of its trips, a rate that would have ranked sixth the previous season. The zone’s rapid contraction after ABS arrived may help explain the shift: when the full zone gets smaller, each part of it does too.
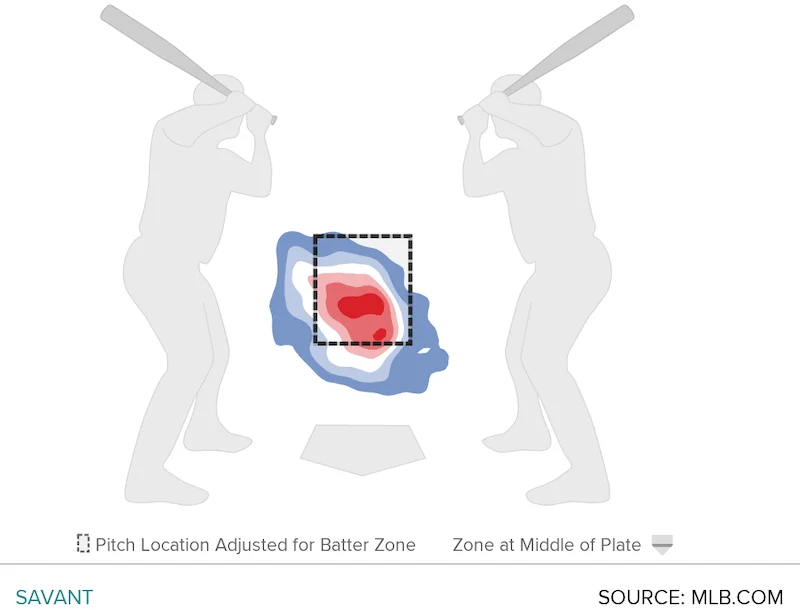
The award for Meatballsiest Pitcher, though, goes to Brewers closer Trevor Megill. His four-seamer went down the middle 12.4% of the time, placing 19th among pitches. But he threw that fastball 65% of the time, giving it one of the highest usage rates in the sample. The combination meant no pitcher threw more middle-middle offerings.
Megill’s willingness to attack the center makes sense when you look at the results. His Zone 5 four-seamers were worth five runs by Statcast’s run values, tied for ninth among all pitches. Pfaadt’s sinker, by comparison, was a middling offering at best, and its middle-middle pitches produced a .514 wOBA. Those sinkers were worth -4 runs, putting them in the bottom 30. Pfaadt gave up seven home runs on meatballs, though most came off his four-seamer rather than the sinker.

At the other end of the middle-middle scale, Brent Headrick’s splitter was the Veganest Pitch. He threw it 162 times and put only one in the heart of the plate: a 0.6% rate. Fifteen of the bottom 16 pitches on this measure were offspeed offerings. For pitchers trying to bury a pitch below the zone and tempt a swing, staying clear of the middle appears to be a manageable plan.
That one Headrick splitter in Zone 5 worked out well enough. The clip also catches a bird crossing in front of the camera just before the pitch, an oddly fitting flourish for such a rare location.

Headrick’s changeup took the Most Heartless Pitch award: it crossed the heart zone only 4.9% of the time. He clearly kept hitters from getting a comfortable look at it. Cooper Criswell’s sinker sat at the other extreme, taking the Heartiest Pitch title with a 41% heart-zone rate. Fastballs claimed 49 of the top 50 spots on that list, which makes Ryan Gusto’s slider a notable exception. It had the 16th-highest heart rate. Gusto’s gyro slider has little break, likely making it easier to aim, and he showed a clear willingness to bring it into the zone.
The shadow zone sits within one baseball’s width of the strike-zone edge. It’s where a pitcher can invite a take, earn a called strike or induce a swing without offering a clean strike-zone pitch. Baltimore’s Albert Suárez owned that territory with his changeup. He put it in the shadow zone 58% of the time, nearly five percentage points ahead of the runner-up. That mark would have led the majors in five of the previous six seasons.
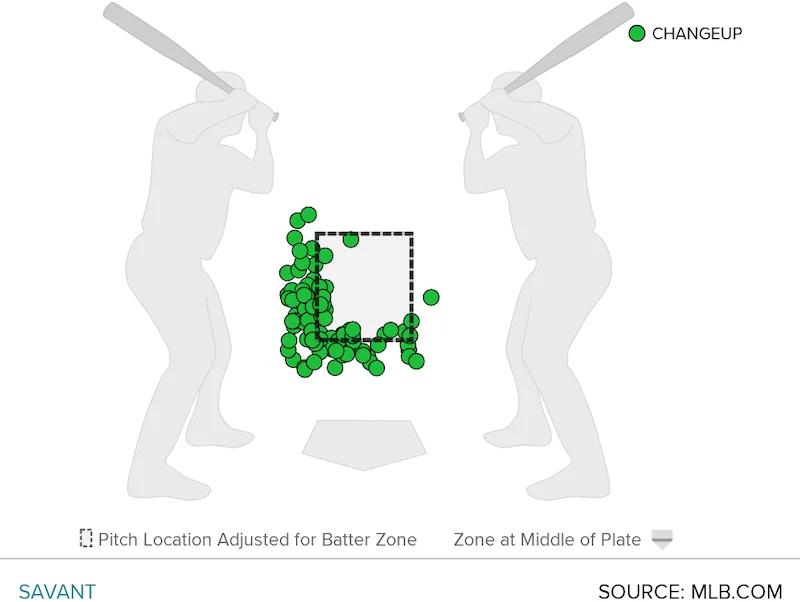
Suárez’s rate reflects a specific plan rather than a general effort to work near the edges. He threw the changeup only to left-handed hitters and consistently aimed for the low, outside corner. The fastballs just below him on the leaderboard were spread more evenly around the zone. Suárez’s chart shows a more deliberate pattern.
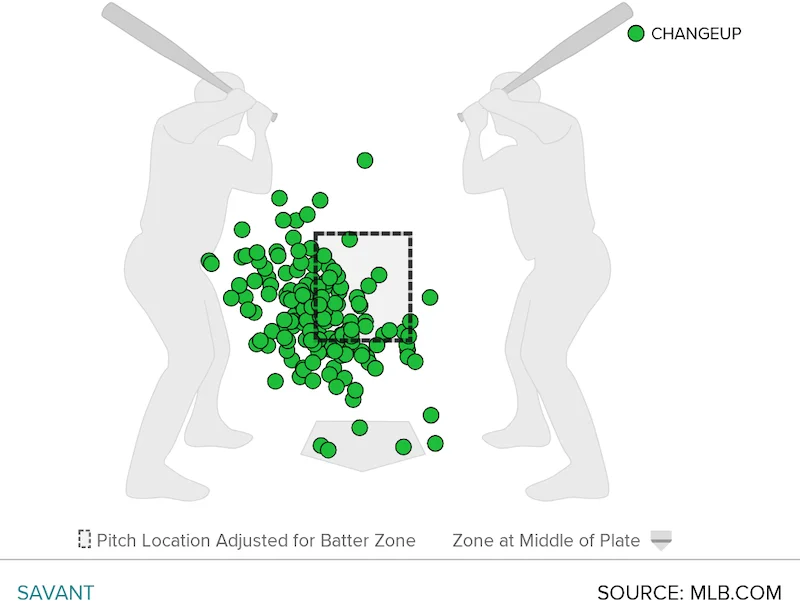
He rarely missed high or toward his glove side, and only five of his changeups could reasonably be called middle-middle. The goal was to make hitters swing at the pitch, take a called strike or accept a ball. He didn’t often offer a hittable changeup as a compromise.
The chase and waste zones call for a different kind of recognition. Many pitches are designed to finish outside the strike zone, so the leaders in chase-zone usage offer little separation: the top five rates were within one percentage point of one another. Statcast run values also put 19 of the top 20 pitches in negative territory. The more revealing question is which pitches did the most damage when they tempted hitters to chase.
Aaron Nola’s knuckle curve was the Chasiest Pitch. Nola had another rough season for the second year in a row, but the curve wasn’t the culprit. He worked it at the bottom of the zone and below, where it remained his best pitch by a wide margin. In the waste zone, it was worth eight runs, the best figure in baseball.
Hitters swung at Nola’s curve 51% of the time it entered the chase zone, the sixth-highest rate among pitches with at least 100 such offerings. They missed 56% of the time, and contact rarely helped them: opponents hit just .041 against it. Nola threw the curve 33% of the time in 2026. Given those results, a larger share of curves looks like a reasonable thought, even if a jump to 50% would be a major change.
Sonny Gray deserves a mention, too. His sweeper generated a 59% chase rate, the highest mark for a pitch in the chase zone. It was worth seven runs, one fewer than Nola’s curve, and was even more valuable on a per-pitch basis.
Grant Taylor’s curveball earned the Least Wasteful Waste Pitch title. A pitch in the waste zone is far outside the strike zone, where contact is generally an unlikely outcome. Yet Taylor’s curve drew a 31% swing rate there, second only to Mason Miller’s slider. Of the 1,540 pitches analyzed, Taylor’s was the only one worth at least one run in the waste zone.
There was just one instance of a batter making contact with Taylor’s curve there. Ozzie Albies tried to check his swing and couldn’t stop it; the pitch had already bounced, and the ball went from the ground into his bat. That’s the sort of unlikely contact it took to put the curve in play.
The Cornerniest Pitch belonged to Merrill Kelly’s slider. The award tracks pitches that land in one of the four true corners of the strike zone, in the shadow zone, rather than anywhere along the edge. Kelly hit a corner 20% of the time, nearly three percentage points more than any other pitch.
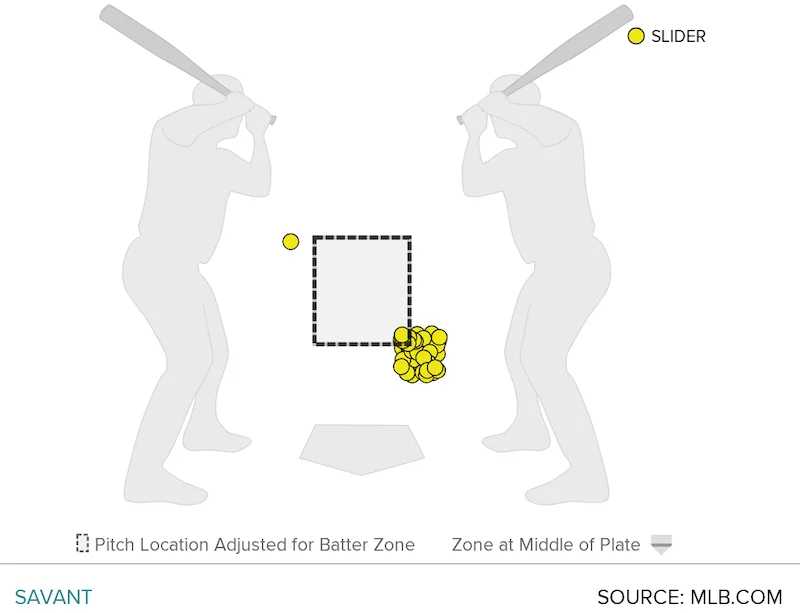
Kelly threw the slider only to right-handed hitters and aimed low and away. Most of the chart’s marks cluster in that corner, forming an almost square shape in Zone 19. Then there’s one stray slider that backed up just enough to catch Zone 11. The pitch’s consistency makes that miss in the opposite corner especially striking.
Four more awards recognize pitches that crossed the plate at extreme average locations. Landen Roupp’s four-seamer was the Highest Pitch, crossing at an average height of 3.55 feet. Brendon Little’s knuckle curve was the Lowest Pitch at 0.98 feet. José Alvarado’s cutter was the Leftiest Pitch, averaging 1.06 feet toward the third-base side from the plate’s center. Jacob Lopez’s changeup claimed the Rightiest Pitch award at 0.90 feet from center in the opposite direction.
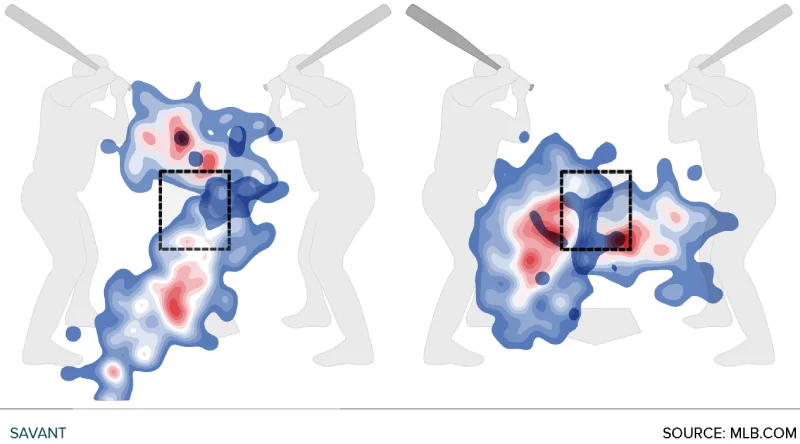
The charts for both groups cover a lot of ground. Reaching an extreme average in one direction means working from a particular part of the plate, but it can also reflect misses scattered across other areas. These pitches’ heat maps are expansive, a reminder that an average location doesn’t tell the whole story of command.
Guerrero’s sinker is the clearest example of a location plan matching a pitcher’s strengths. The journeyman reliever had a standout season for the Red Sox in his first year back from Japan. At 6-foot-8 with considerable extension, he averaged 100.2 mph on the sinker. In his first major-league stint, he threw a four-seamer 80% of the time. This season, the sinker was his weapon of choice: he used it 86% of the time and put 52.4% of those pitches in the strike zone.
That was the highest zone rate in baseball, more than six percentage points above the second-place pitch. The rate would have led the majors in four of the previous five seasons, even before accounting for the smaller zone in 2026. Guerrero’s command was not merely about throwing strikes, either. Include pitches that missed the zone but landed in the shadow zone, and his rate climbed to 68.2%, again by a wide margin. His sinker earned both the Zoniest Pitch and Zone-Adjacentest Pitch honors.
Guerrero didn’t miss many bats, but hitters expected the sinker to reach the plate. When it didn’t, they chased at a strong rate. He struck out an above-average number of batters, walked nobody and produced plenty of weak contact by challenging hitters in the zone. The combination is the point: a fastball with this kind of velocity can support an attack-first approach, and consistent strikes make the occasional miss more tempting to chase.
Location still matters in a season when teams are increasingly comfortable letting quality stuff work over the plate. Megill could survive middle-middle four-seamers because the pitch was excellent; Pfaadt’s sinker paid a much steeper price. Suárez and Kelly showed how repeatable plans can turn the edges into assets, while Nola and Taylor got value from pitches far outside the zone. Guerrero’s sinker ties the themes together: the best location plan depends on what a pitch can do once it gets there.
Velocity, movement and location are now covered. The final installment turns to the pitches that produced the strongest results.